2026, so far
The year in the data it left behind.
Updated · day 298 of 365
- Building
- 1,434 h
- Contributions
- 6,287
- Days logged
- 261 of 298
- Page views
- 15.7K
More than half of the hours came after July.
Every bar is a day of time spent building, logged by WakaTime. From August on, the bars hold 54% of the year’s hours, about 36 forty-hour weeks. Pick a moment to zoom in, or use the arrow keys.
- Before August
- August onward
The numbers
| Month | Hours | Contributions |
|---|---|---|
| January | 83 | 336 |
| February | 182 | 409 |
| March | 140 | 384 |
| April | 129 | 1,078 |
| May | 78 | 660 |
| June | 49 | 484 |
| July | 0 | 59 |
| August | 240 | 1,182 |
| September | 288 | 949 |
| October | 245 | 746 |
01 · Rhythm
Noon is the busiest hour. Midnight is the third.
Hours of the day in Eastern time, added up across the year. Weekends run at about 64% of a weekday: quieter, not off. The longest unbroken run was 93 days, Feb 6 – May 9, and it ended around the day I finished at GWU.
- of 298 days with work logged
- 261
- of 298 days with work logged
- days in a row, the longest run
- 93
- days in a row, the longest run
- of a weekday’s hours, on weekends
- 64%
- of a weekday’s hours, on weekends
The numbers
| Hour | Hours |
|---|---|
| Midnight | 102 |
| 1 am | 55 |
| 2 am | 24 |
| 3 am | 15 |
| 4 am | 7 |
| 5 am | 9 |
| 6 am | 8 |
| 7 am | 6 |
| 8 am | 13 |
| 9 am | 56 |
| 10 am | 95 |
| 11 am | 76 |
| Noon | 106 |
| 1 pm | 103 |
| 2 pm | 100 |
| 3 pm | 97 |
| 4 pm | 97 |
| 5 pm | 71 |
| 6 pm | 75 |
| 7 pm | 78 |
| 8 pm | 70 |
| 9 pm | 63 |
| 10 pm | 54 |
| 11 pm | 63 |
02 · Words and reach
Page views nearly tripled the month “Harness engineering” came out.
15,701 page views on anuragd.me this year, 3,106 of them in June. Four essays in all, 25 minutes of reading.
Page views by month · a dot marks a month with a new essay
The numbers
| Month | Page views |
|---|---|
| January | 1,761 |
| February | 419 |
| March | 500 |
| April | 563 |
| May | 1,075 |
| June | 3,106 |
| July | 2,530 |
| August | 1,692 |
| September | 2,142 |
| October | 1,913 |
“Harness engineering is the work of turning models into systems you can operate, inspect, and trust: tools, memory, permissions, feedback loops, and stopping conditions.”
6.7K
Transit MCP requests a day, from AI assistants asking for live DC Metro and NYC Subway arrivals.
03 · Away from the desk
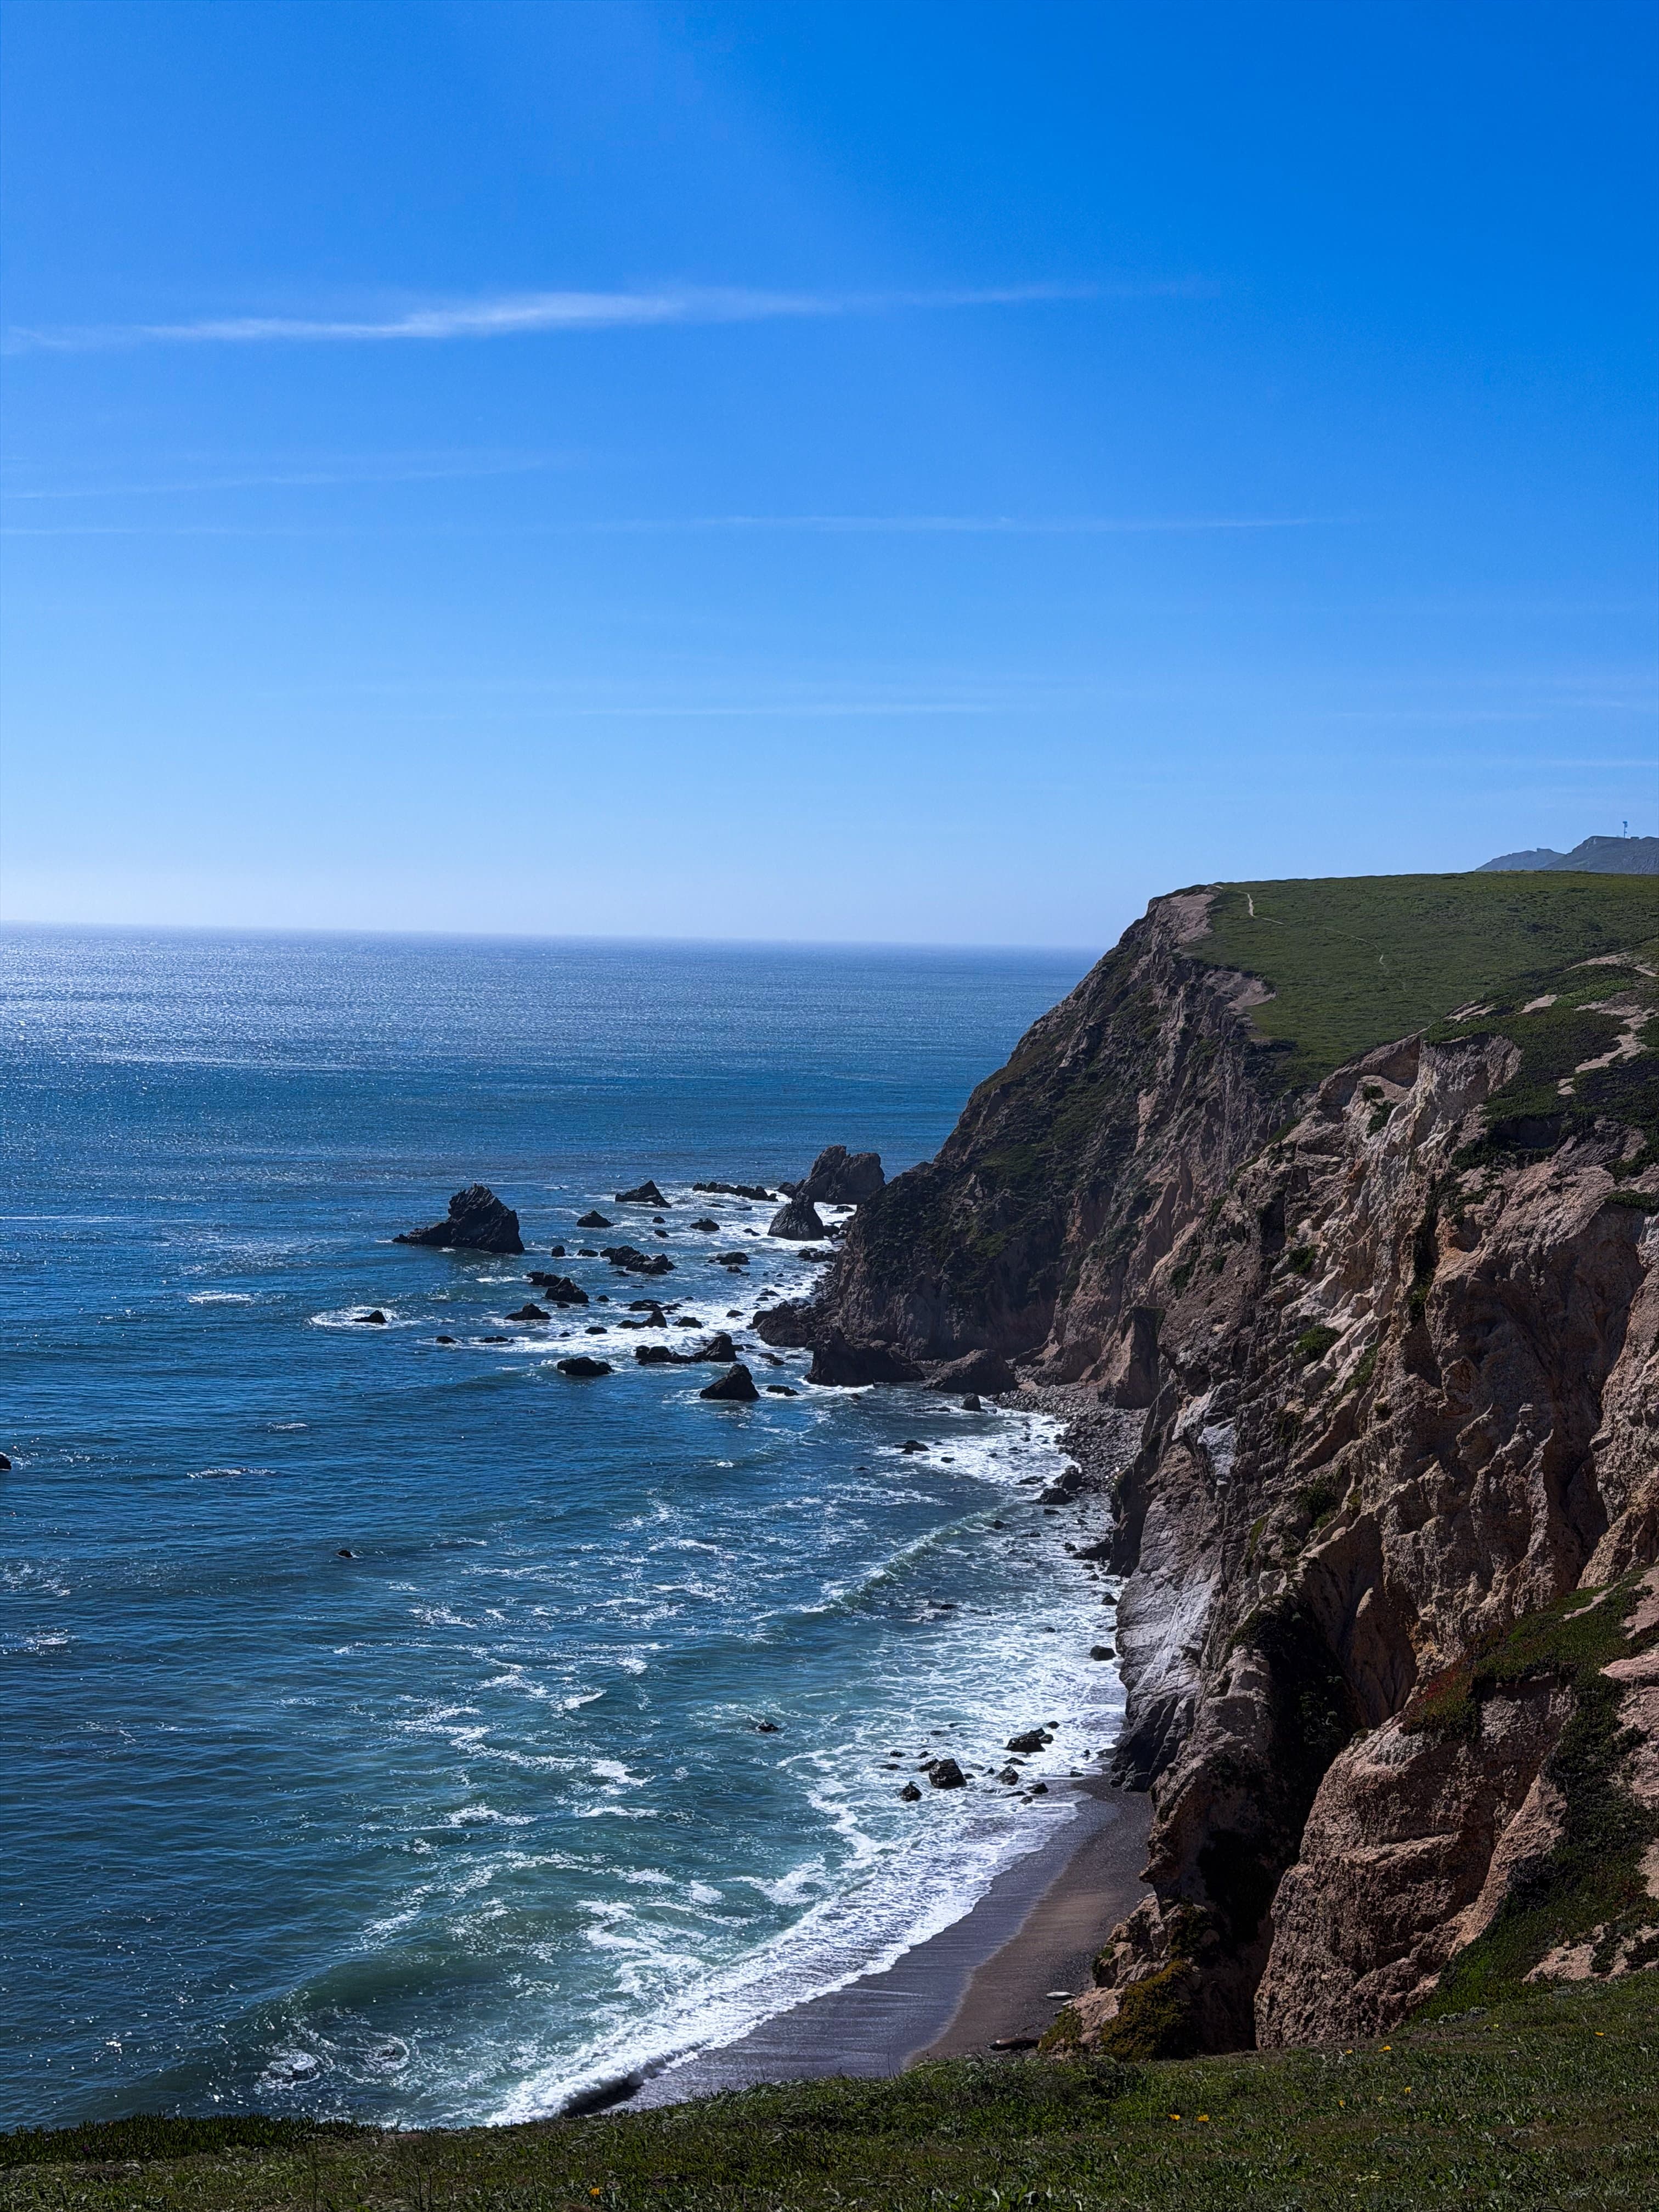
A trip to San Francisco, and 80 miles on a bike.
20 rides and 7.8 hours in the saddle since WHOOP started tracking on Aug 18.


79.7 mi
ridden, Aug 18 – Oct 25
Miles per week · the best week was Sep 7, at 21.9 mi